Electorates and turnout
Size of the electorate
Average electors per parliamentary constituency, 1962–2024
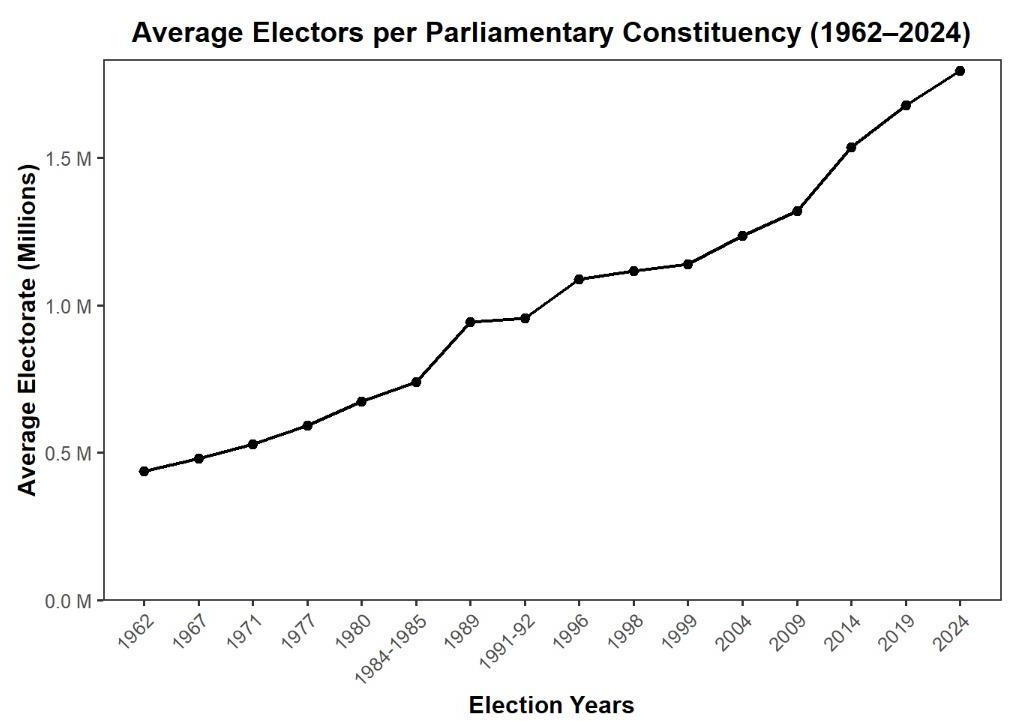
Line chart. The average Lok Sabha constituency grew from about 0.44 million electors in 1962 to about 1.8 million in 2024.
Average electors per assembly constituency, 1962–2026
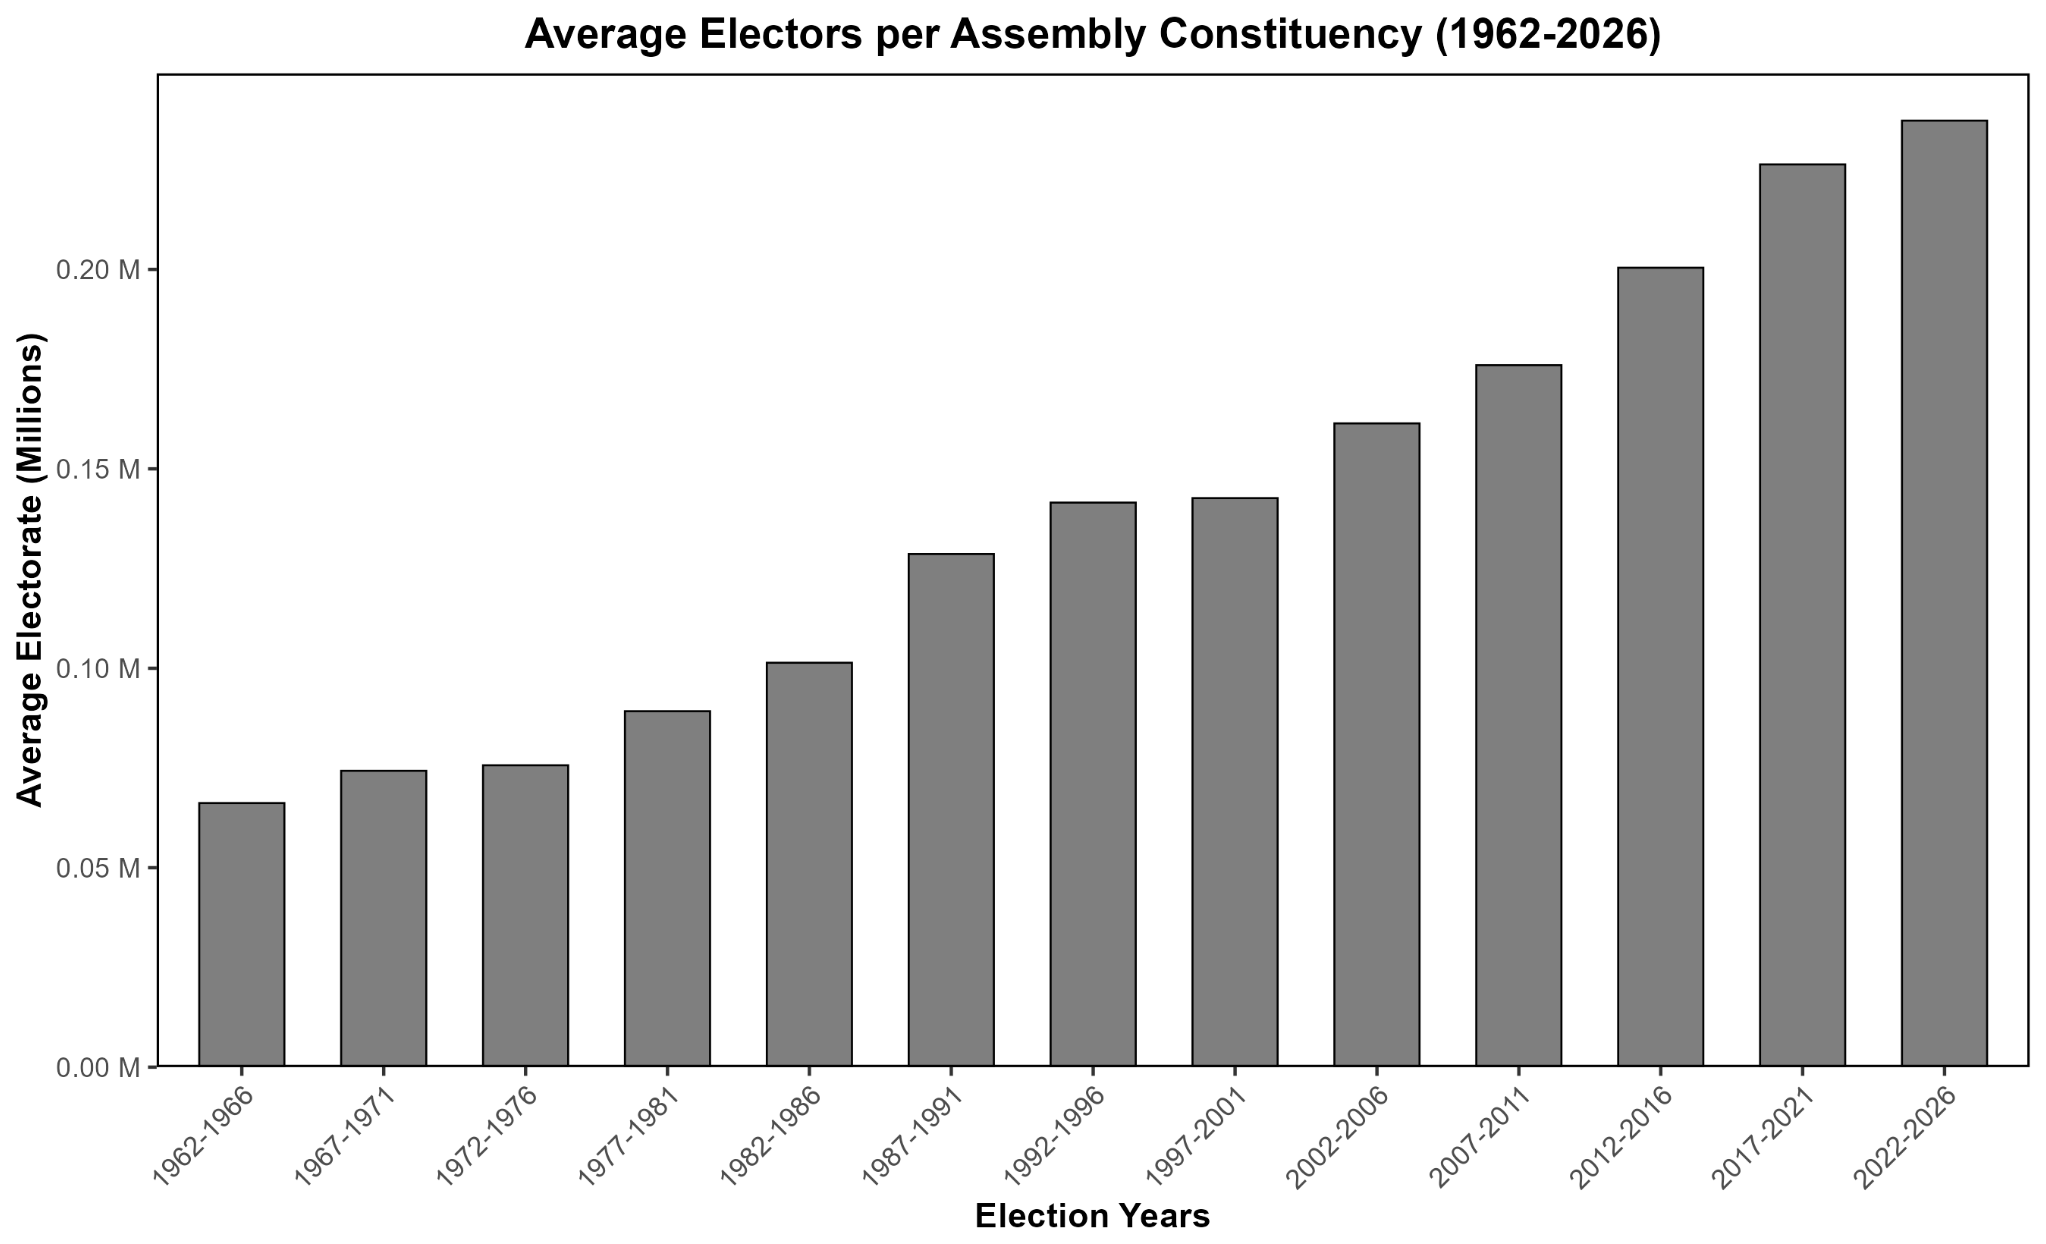
Bar chart by five-year period. The average assembly constituency grew from about 0.07 million to about 0.24 million electors.
Summary statistics of elector density and parliamentary constituency area
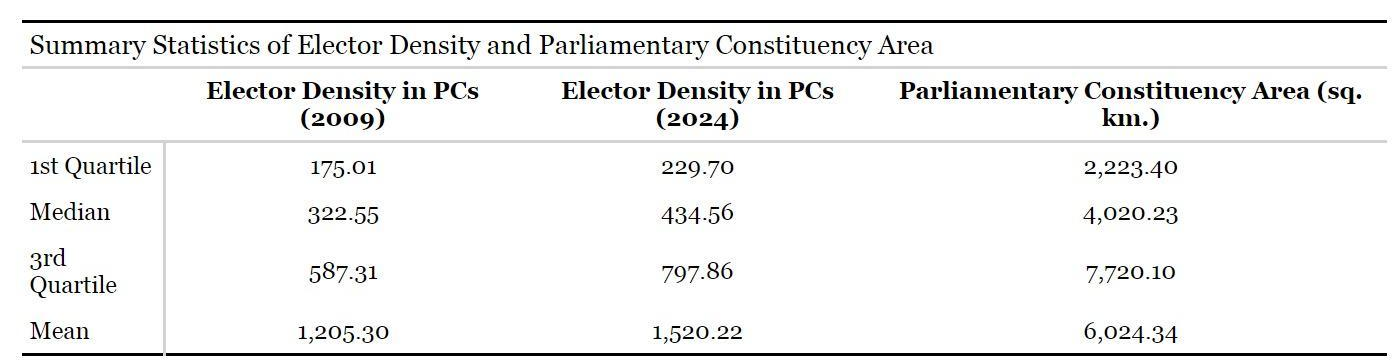
Quartiles and means of electors per square kilometre in 2009 and 2024, and of constituency area. Median area is 4,020.23 sq. km; median 2024 density is 434.56 electors per sq. km against a mean of 1,520.22.
Turnout
National turnout in Indian general elections, 1962–2024
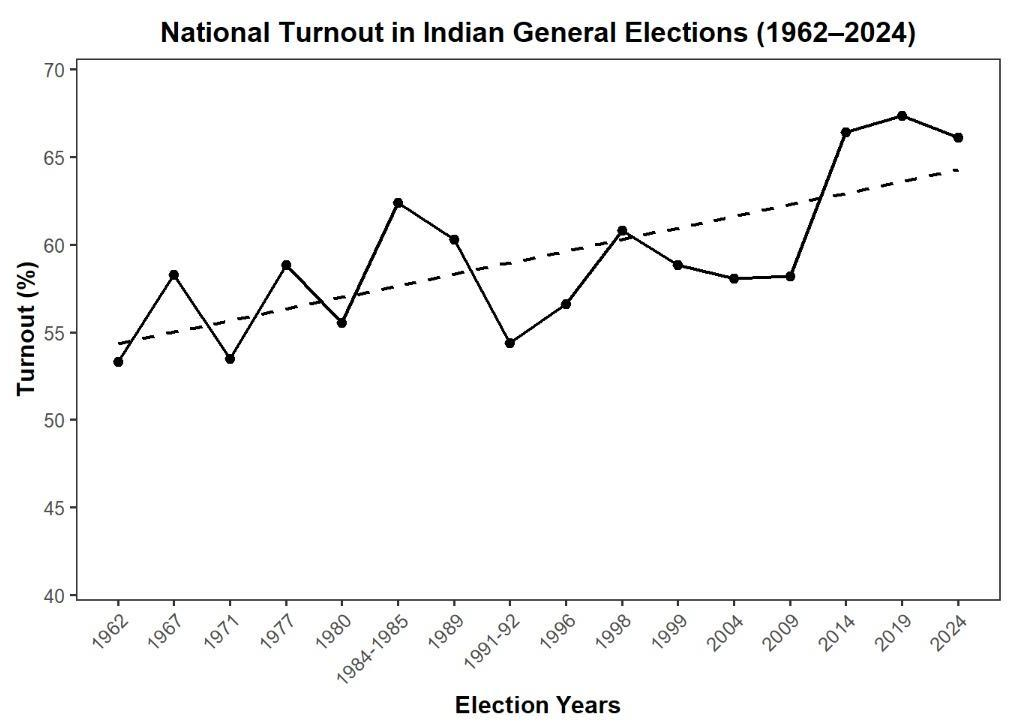
Line chart with a linear trend. Turnout rises from about 53% in 1962 to 66–67% in 2014–2024.
State assembly election turnout, 1962–2026
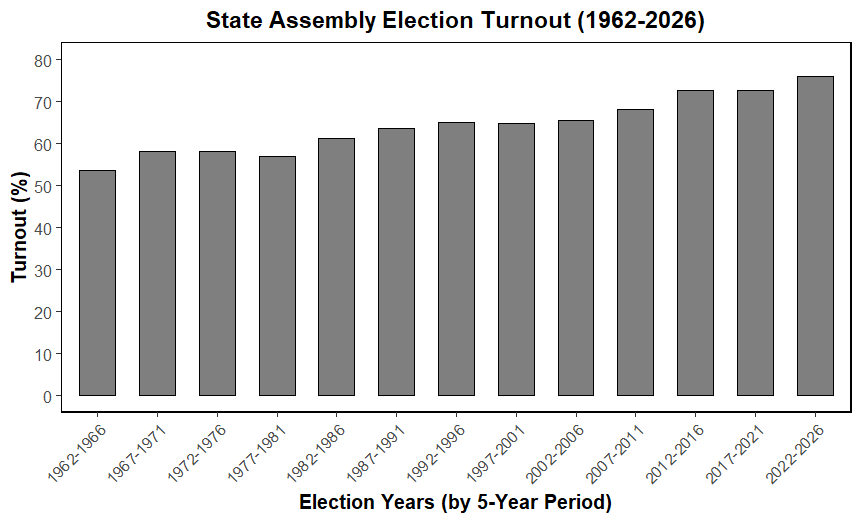
Bar chart by five-year period. Assembly turnout rises steadily from about 54% to about 76%.
National voter turnout across democracies for the last three elections
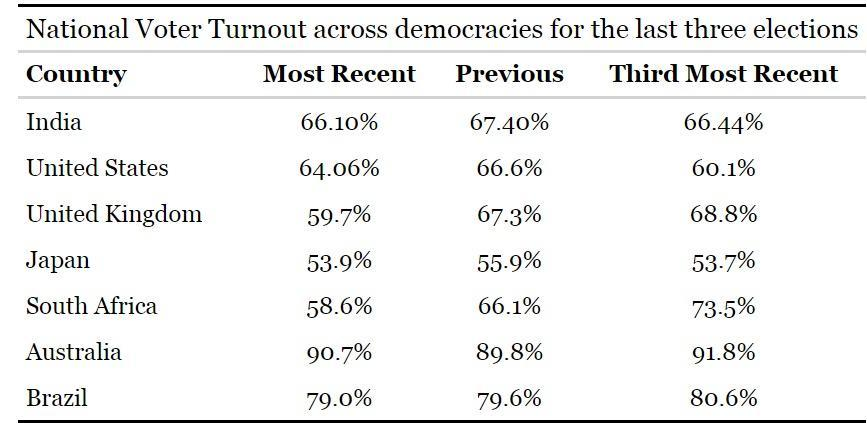
India, United States, United Kingdom, Japan, South Africa, Australia and Brazil. India's last three turnouts: 66.10%, 67.40%, 66.44%.
Male and female voter turnout, 1989–2024
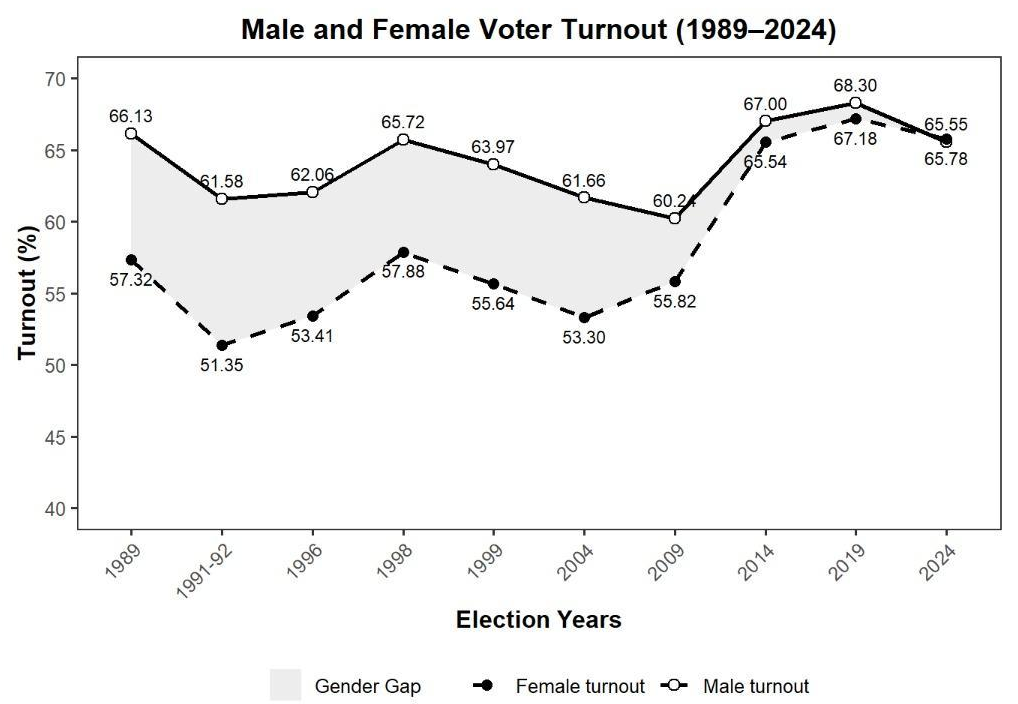
Two lines with the gender gap shaded. The gap is about nine points in 1989 and has closed by 2024, when both are around 65.6–65.8%.
Voter turnout in general and reserved constituencies, Lok Sabha 2009–2024
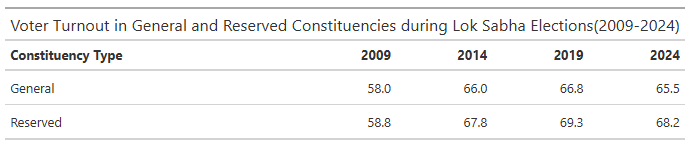
Reserved constituencies turn out slightly higher than general ones in every election from 2009 to 2024.
Voter turnout by GEN, SC and ST constituencies, Lok Sabha 2009–2024
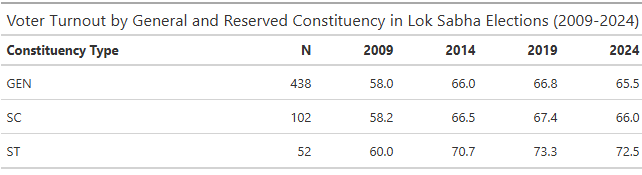
ST-reserved constituencies have the highest turnout, reaching 73.3% in 2019.
Average constituency turnout by diversity level
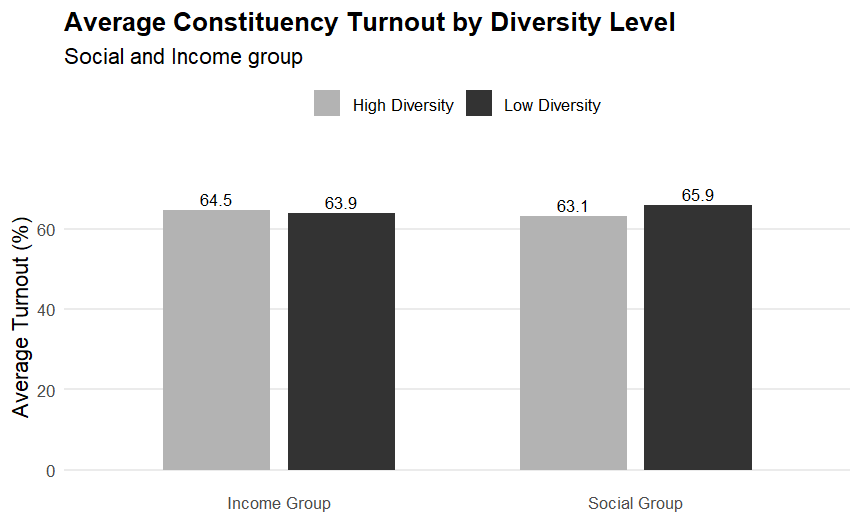
Grouped bars for income and social diversity. High and low diversity constituencies differ by less than three points.
Weighted turnout by social group, 2019
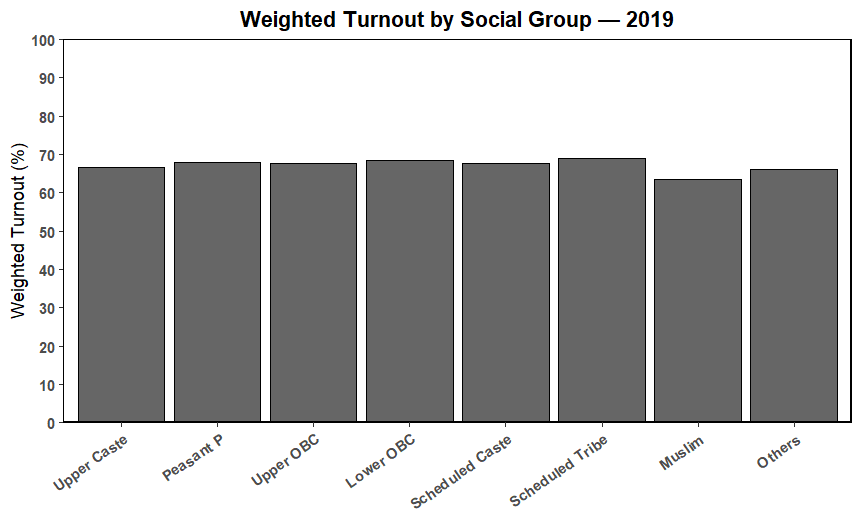
Bar chart. Turnout is between roughly 63% and 69% for every social group; Muslims are lowest and Scheduled Tribes highest.
Democracy and vote efficacy (NES surveys)
Suppose there were no parties or elections, could government be run better?
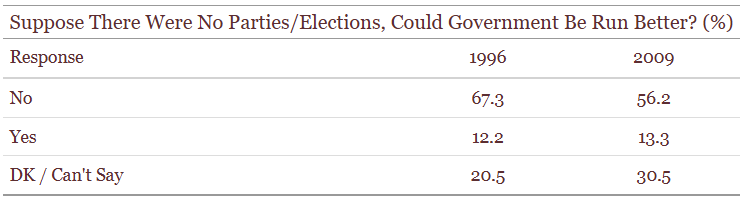
NES 1996 and 2009. Those answering no fell from 67.3% to 56.2%.
Is democracy better than any other form of government?
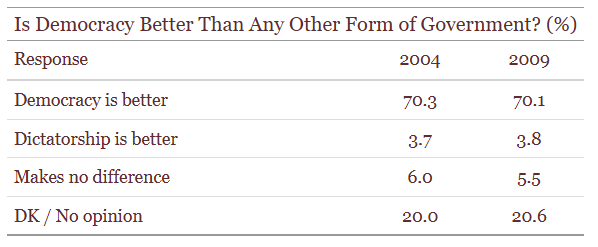
NES 2004 and 2009. About 70% answer that democracy is better in both years.
Do you think your vote has an effect?
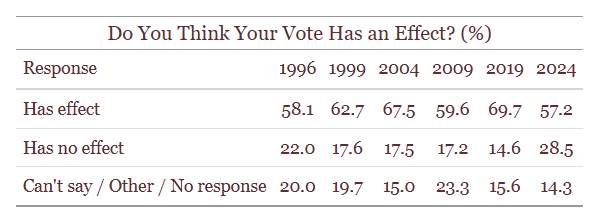
NES 1996–2024. The share saying their vote has an effect ranges from 57.2% to 69.7%.
Weighted turnout by vote efficacy belief, 2004 and 2019
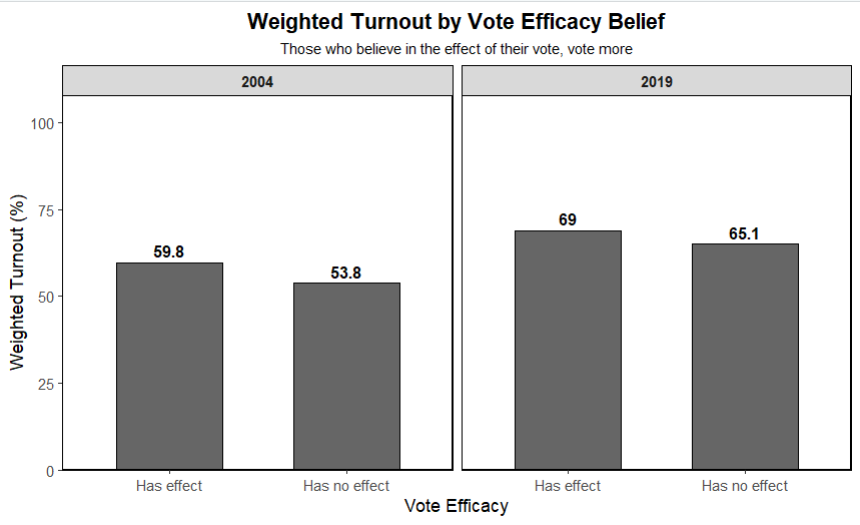
Faceted bars. Those who believe their vote has an effect turn out more: 59.8% vs 53.8% in 2004, 69% vs 65.1% in 2019.
Belief in democracy and vote efficacy, 2004
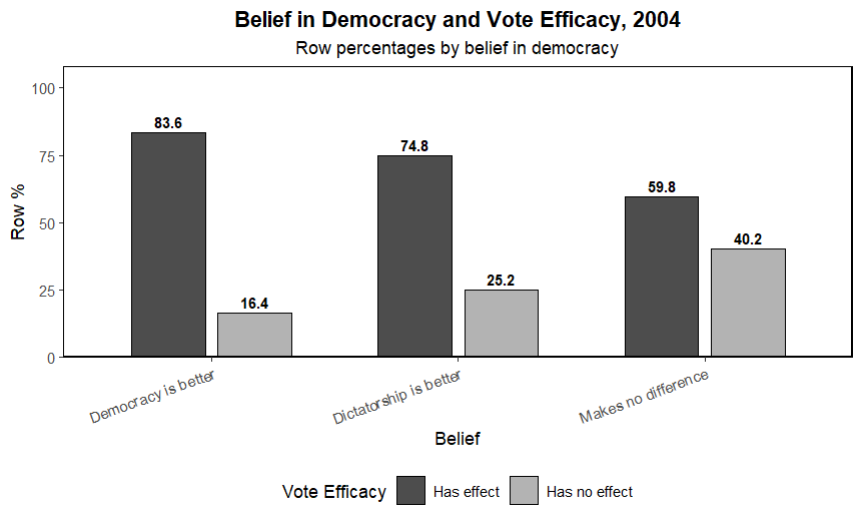
Grouped bars of row percentages. 83.6% of those who think democracy is better also say their vote has an effect.
Urban and regional differences in turnout
Average voter turnout by urban quartile, 2009–2024
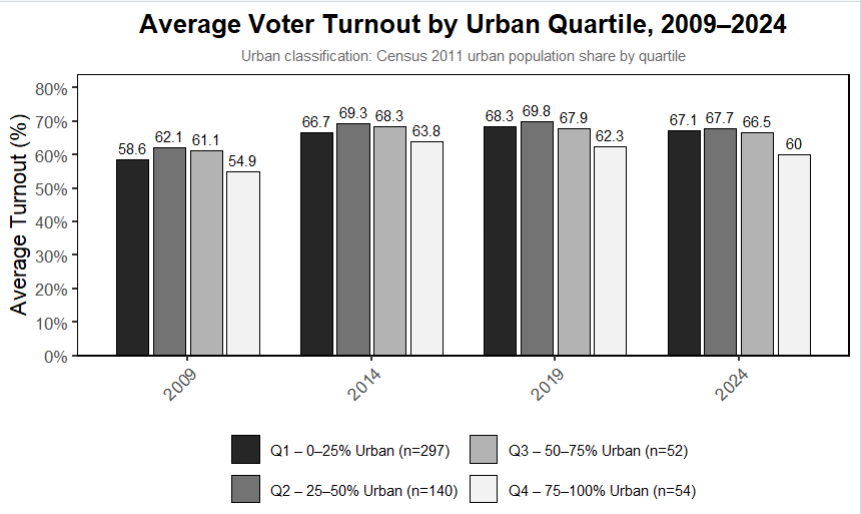
Grouped bars. The most urban quartile of constituencies has the lowest turnout in every election.
Average voter turnout by urban tercile, 2009–2024
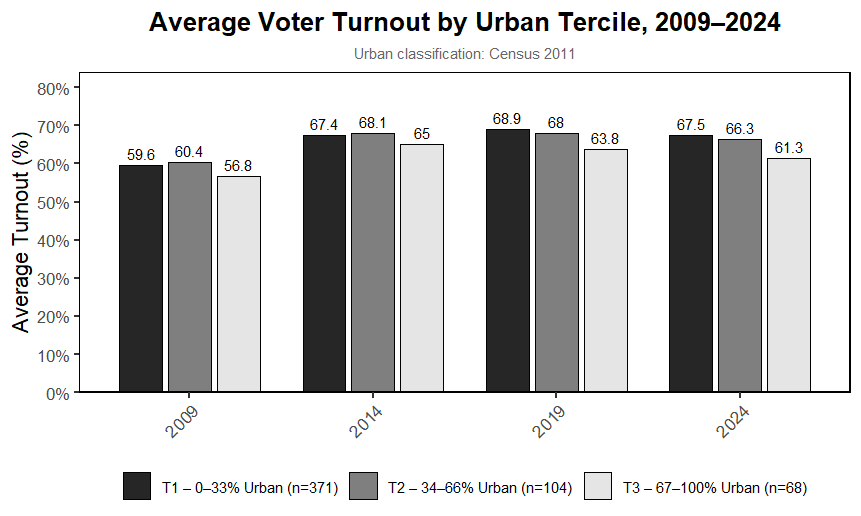
Grouped bars. The most urban tercile has the lowest turnout in every election, at 61.3% in 2024.
Average Lok Sabha voter turnout across states, 2009–2024
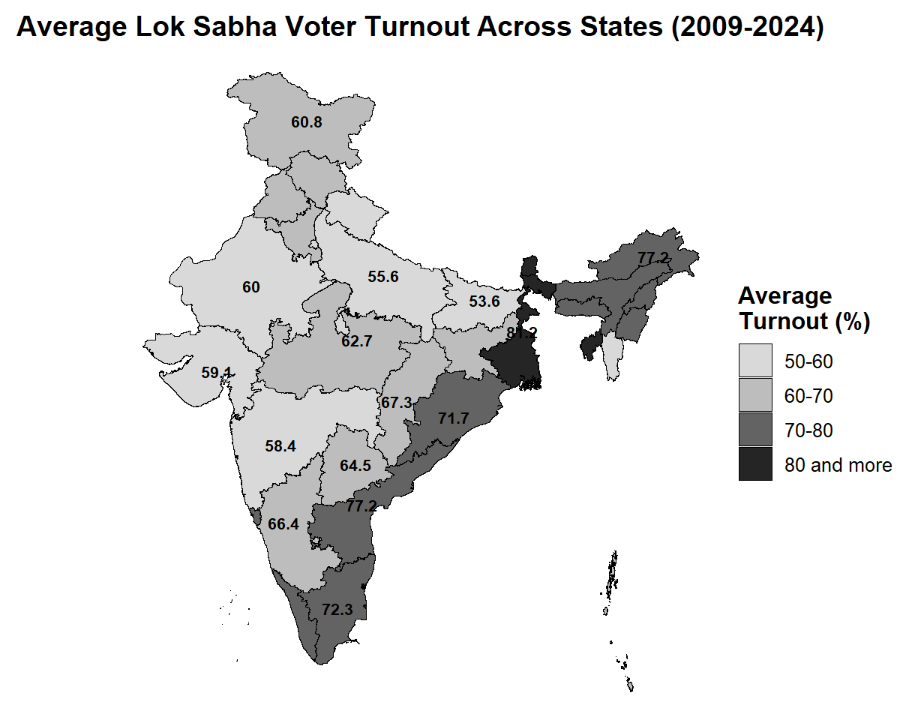
Choropleth map of India in four shades from 50–60% to 80% and above. The east and northeast have the highest turnout.
Average state assembly election turnout by state, 2008–2026
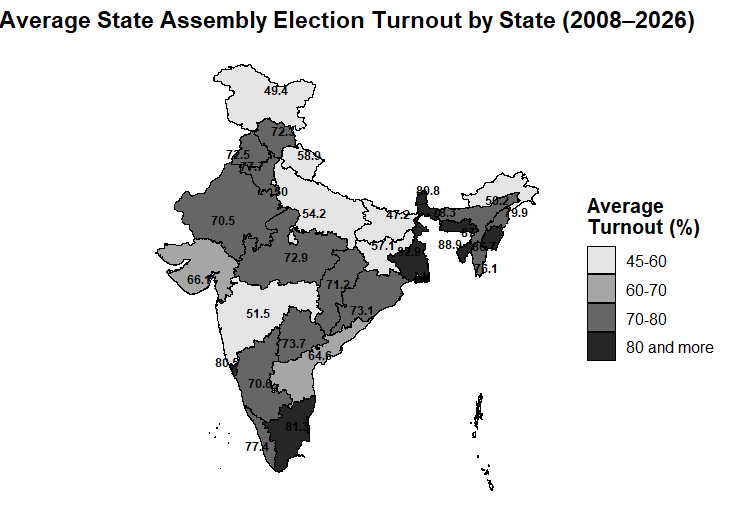
Choropleth map of India in four shades from 45–60% to 80% and above.