Competition, loyalty and volatility
Margins of victory
Average margin of victory in Lok Sabha elections, 1962–2024
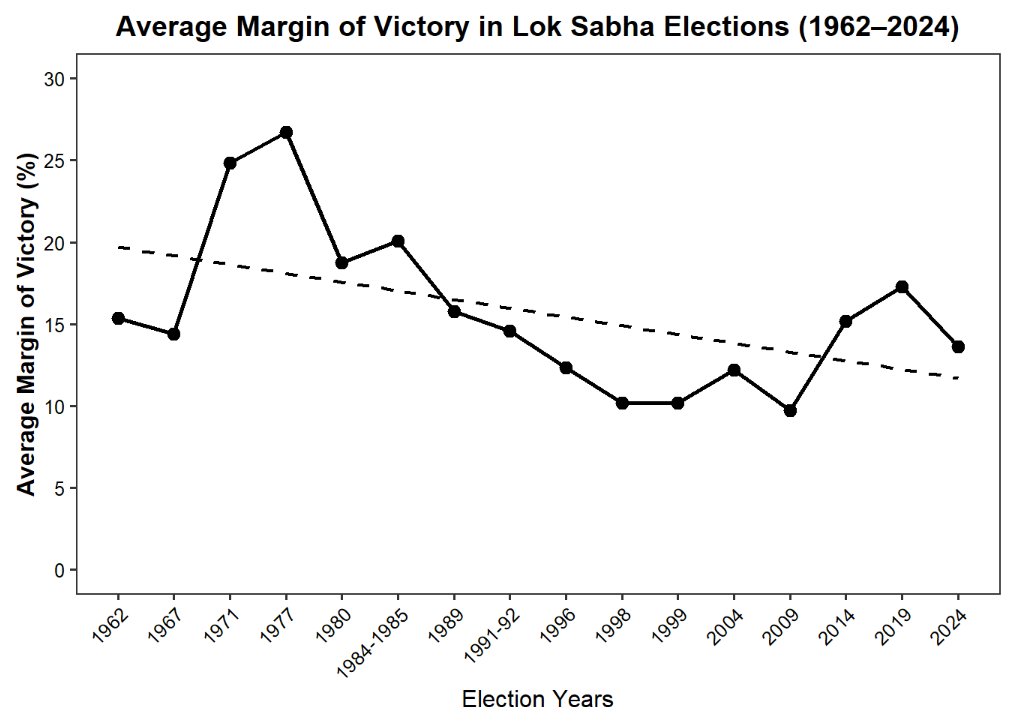
Line chart with a declining linear trend. Margins peak at about 27% in 1977 and fall to about 13.5% in 2024.
Average margin of victory in state assembly elections, 1962–2026
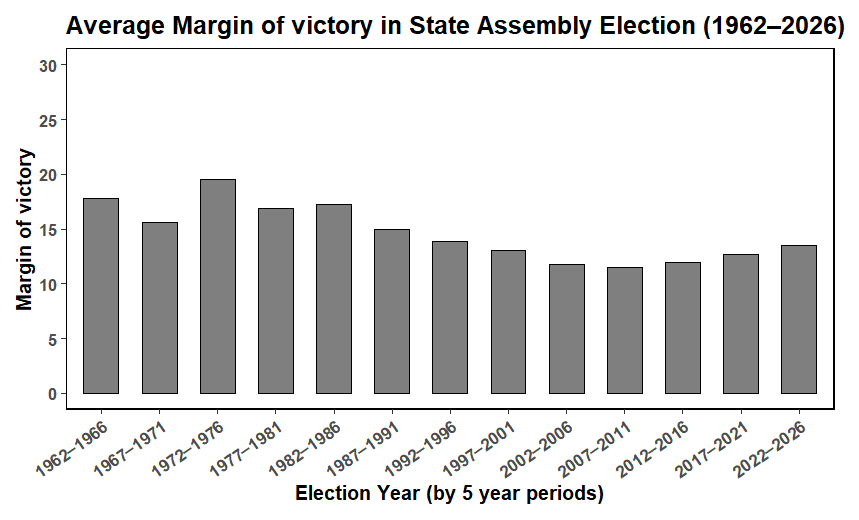
Bar chart by five-year period. Margins fall from 18–20% in the 1960s and 70s to 12–13% after 2002.
Lok Sabha constituencies with a margin of victory greater than 20%, 1962–2024
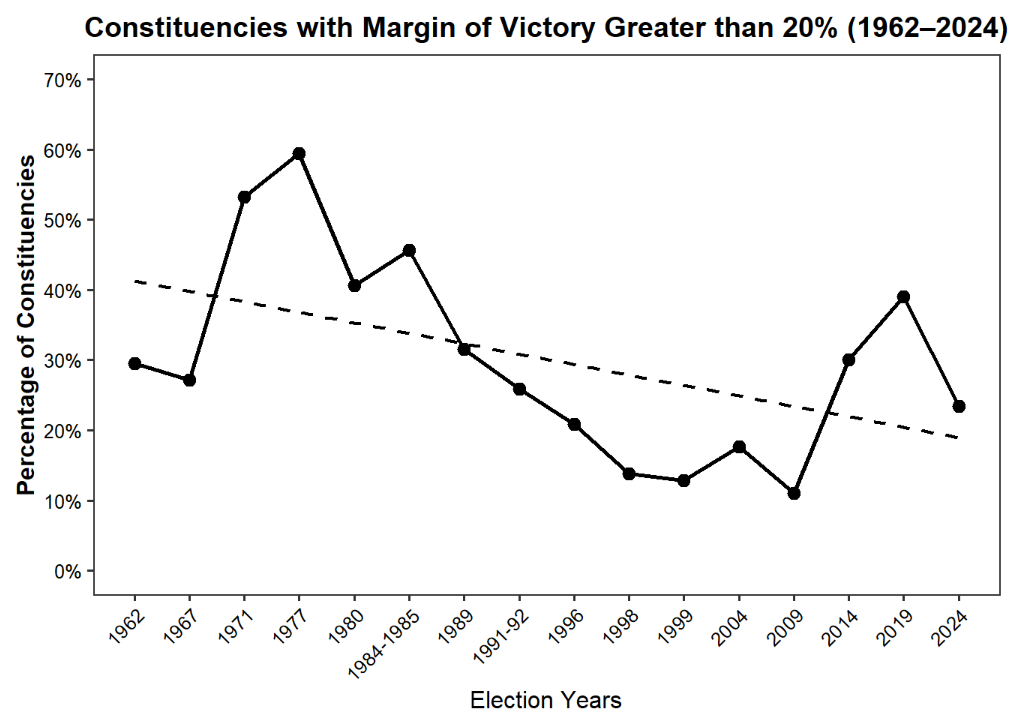
Line chart with a declining trend. The share peaks near 60% in 1977 and is about 23% in 2024.
Assembly constituencies with a margin of victory greater than 20%, 1962–2026
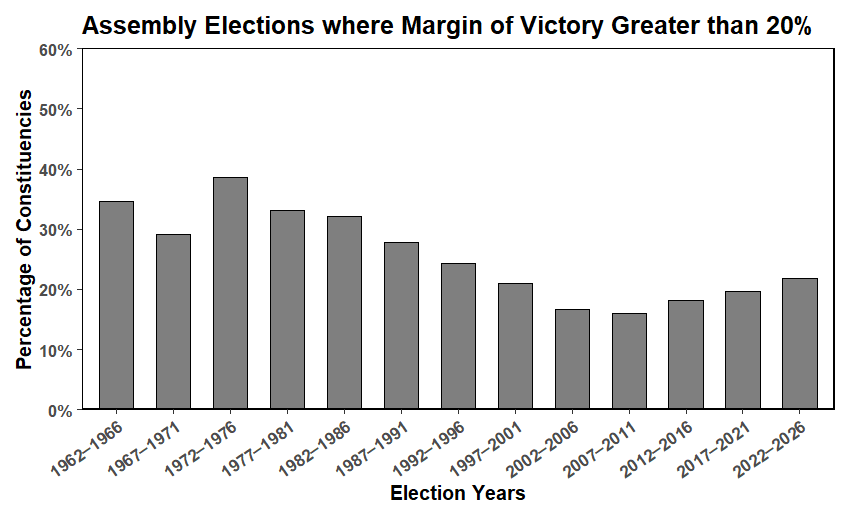
Bar chart by five-year period. The share falls from 35–39% to about 16–22%.
Average margin of victory in national elections
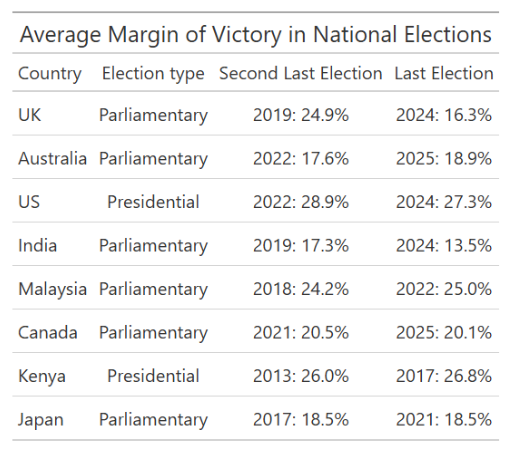
UK, Australia, US, India, Malaysia, Canada, Kenya and Japan. India's last margin was 13.5%, the lowest in the table.
Repeat winners and party loyalty
Number of times the same party won a constituency (Lok Sabha)
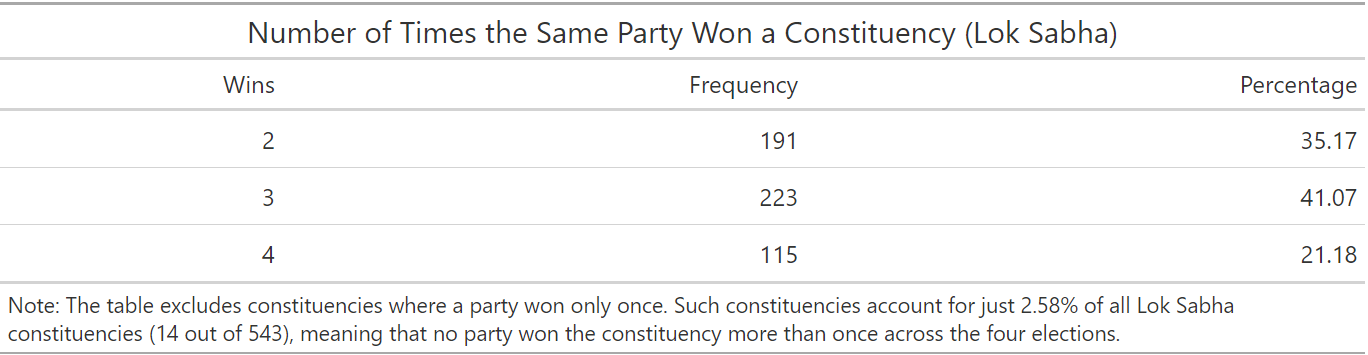
Across four elections, 41.07% of constituencies were won three times by the same party.
Number of times the same party won a constituency (assembly)
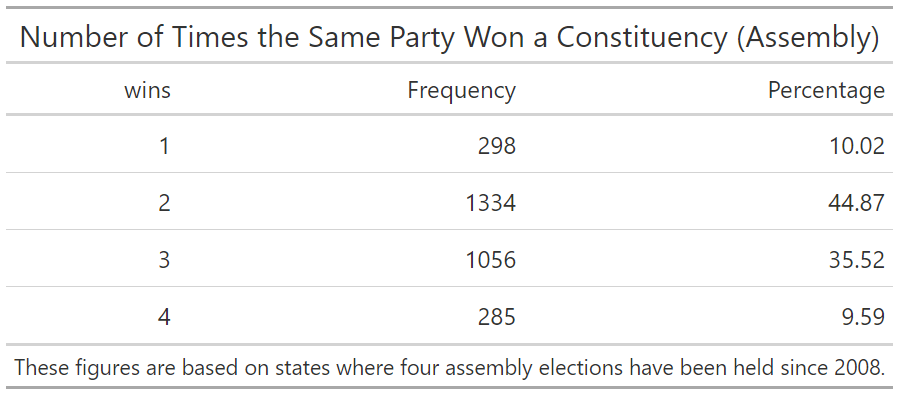
States with four assembly elections since 2008. 44.87% of seats were won twice by the same party.
Frequency of the same candidate winning a constituency (Lok Sabha)
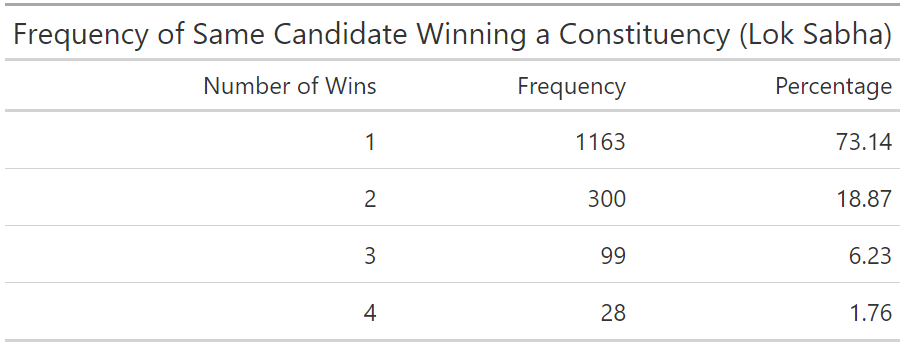
73.14% of winning candidates won only once; 1.76% won four times.
Frequency of constituencies where the same candidate won (Lok Sabha)
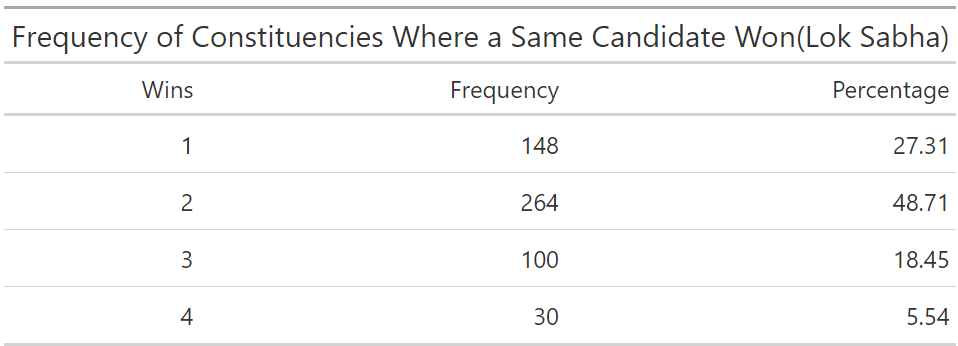
In 48.71% of constituencies the same candidate won twice.
Party loyalty across surveys
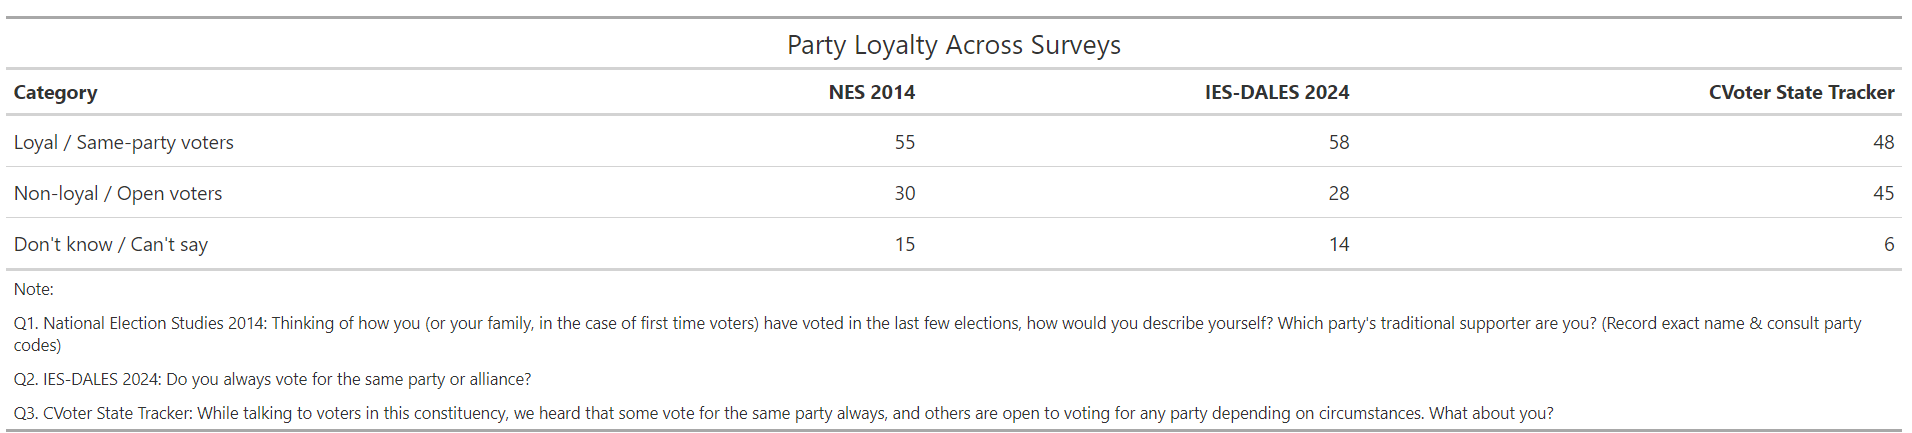
NES 2014, IES-DALES 2024 and CVoter State Tracker. Loyal voters are 55%, 58% and 48% respectively.
First preference while making a voting decision, and whether respondents vote for the same party
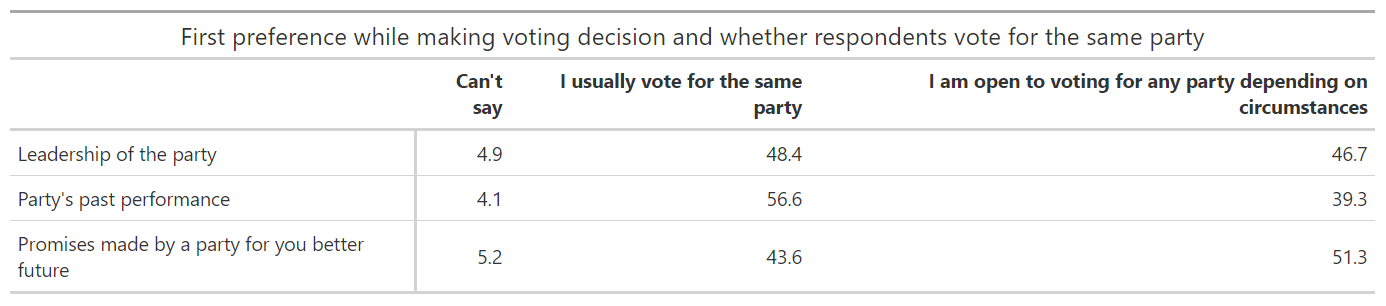
Those who choose on the party's past performance are most likely to vote for the same party (56.6%).
Electoral volatility
Average electoral volatility in Lok Sabha elections
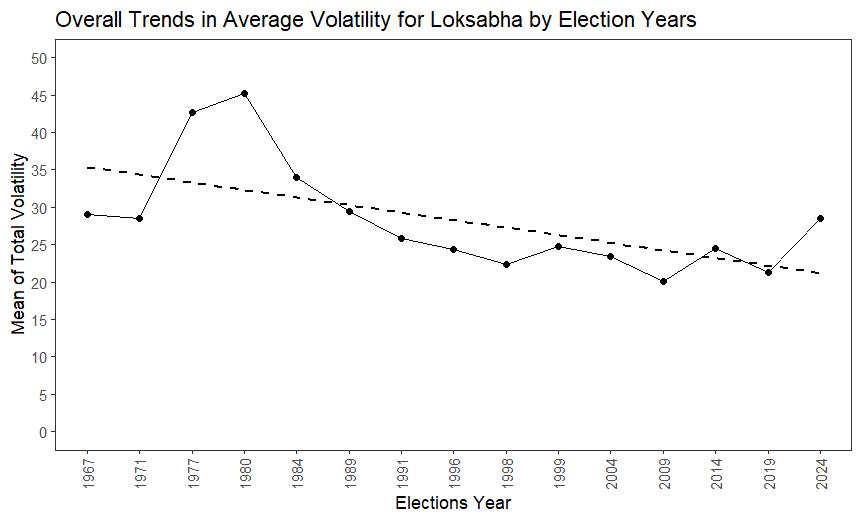
Line chart with a declining trend. Volatility peaks at about 45 in 1980 and rises to about 28.5 in 2024.
Average assembly electoral volatility, 1962–2026
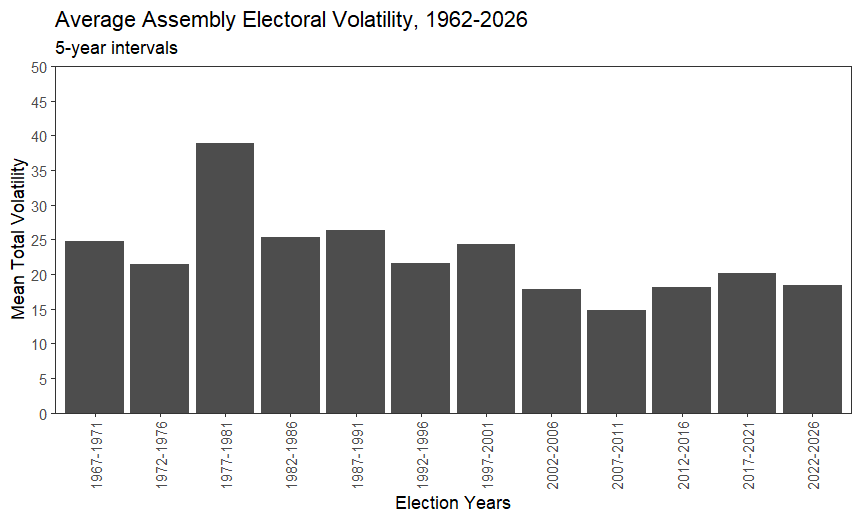
Bar chart by five-year period. Volatility peaks at about 39 in 1977–1981.
Average assembly electoral volatility with trend, 1962–2026
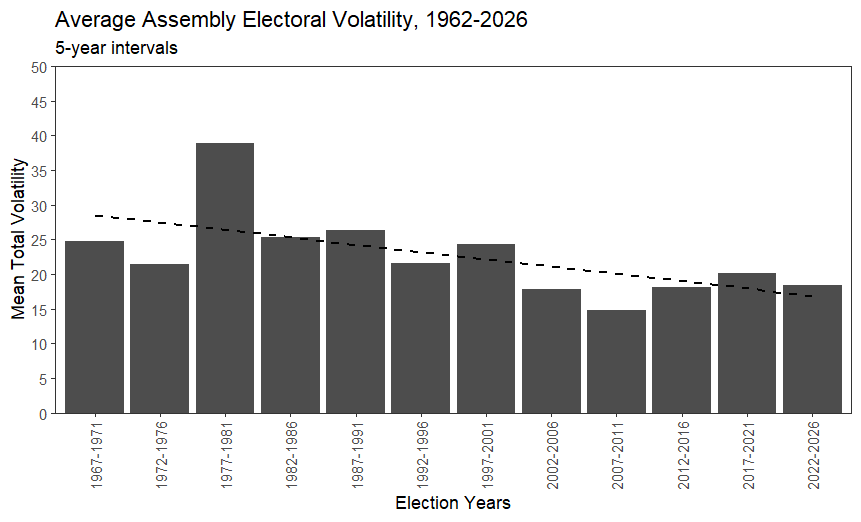
The same series as the previous figure, with a declining linear trend line.
Average turnout by EC tertile, split by urban and rural
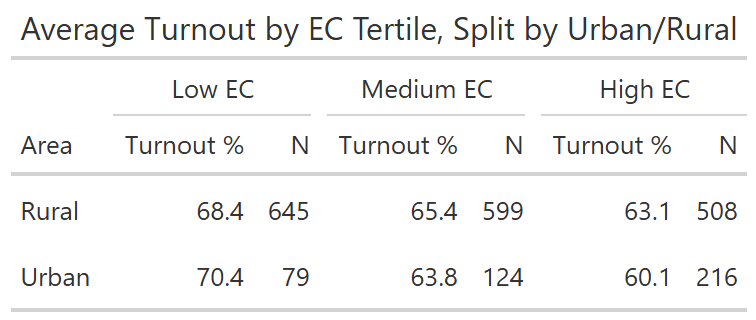
Turnout falls from low to high EC tertile in both rural and urban constituencies.
Average turnout by EC tertile, split by urban band
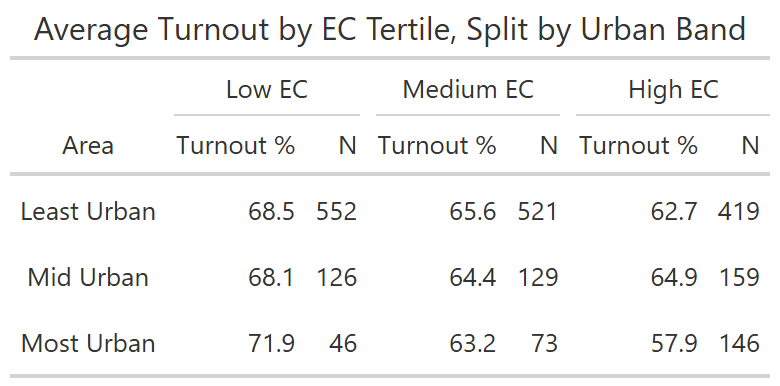
Turnout falls from low to high EC tertile; the most urban band drops from 71.9% to 57.9%.