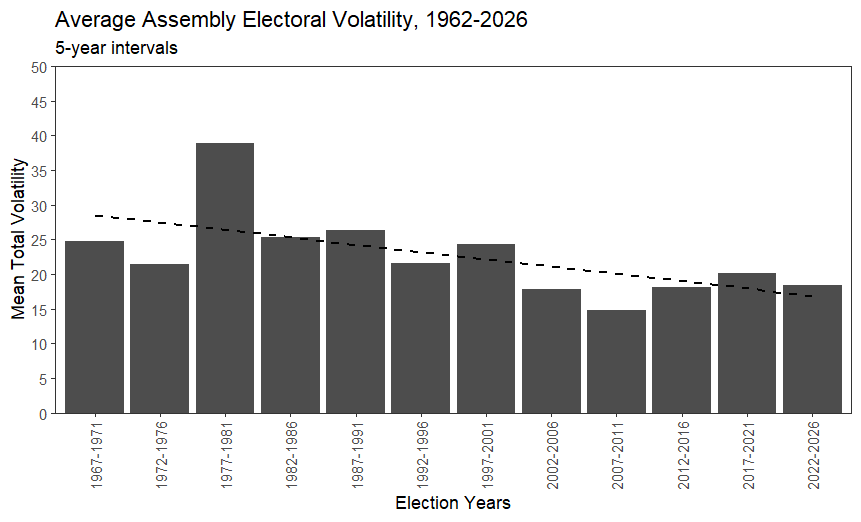
Figure 3.7Average assembly electoral volatility with trend, 1962–2026The same series as the previous figure, with a declining linear trend line.Download PNGCopy linkFigure 3.6Average assembly electoral volatility, 1962–2026Table 3.8Average turnout by EC tertile, split by urban and rural